
by Maia de la Calle. Rutgers Economic Advisory Service (R/ECON™)
Housing affordability and ownership accessibility
The main expense incurred by New Jersey’s residents is shelter or housing. As of 2019, New Jersey ranked third in the country for median monthly housing costs, after California and Hawaii.[1] In that same year, the median gross rent for a two-bedroom apartment in New Jersey was $17,316; hence, a four-person family (two adults and two children) spending this amount in housing translated to 67 percent of the federal poverty level threshold ($25,926).[2] In light of the state’s hefty housing costs, this analysis examines ownership status, burden of housing costs, and measures of crowded housing within the state.
To begin this analysis, Figure 1.1 shows the shifts in housing occupancy tenure over time in New Jersey. Note that “rentership” rises along decreases in ownership rates— a 3.1 percentage point change from 2010 to 2019. This suggests that an increasing share of New Jerseyans might have become priced out of owning a home. Or perhaps the risks of home ownership, made painfully evident during the Great Recession, manifested this change in consumer behavior. Due to post-pandemic rises in housing prices, coupled with low inventory and increasing interest rates, it is likely that the state’s share of renters will continue to grow in the near term.
Figure 1.1: Housing occupancy tenure: NJ 2010-2019
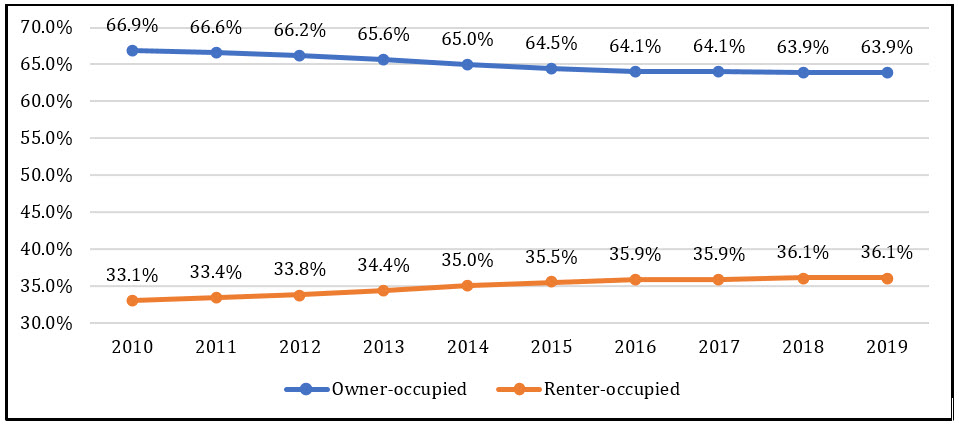
Source: U.S. Census Bureau, 2010-2019. [3] Prepared by R/ECON™.
Table 1.1 displays the shares of owner- and renter-occupied housing by county for 2010 and 2019. These results suggest that, with the exception of Cape May, all New Jersey counties experienced a rise in the share of renter households from 2010 to 2019. Moreover, counties with above-state-average shares of renter households also tend to have above-state-average poverty rates (e.g., Essex, Passaic, and Hudson). The last column in Table 1.1 also indicates that from 2010 to 2019, Mercer, Warren, and Somerset counties experienced the highest increase in shares of renter-occupied households (4.8, 4.1, and 3.9 percentage points, respectively).
Table 1.1: Housing occupancy tenure: NJ Counties, 2010 and 2019
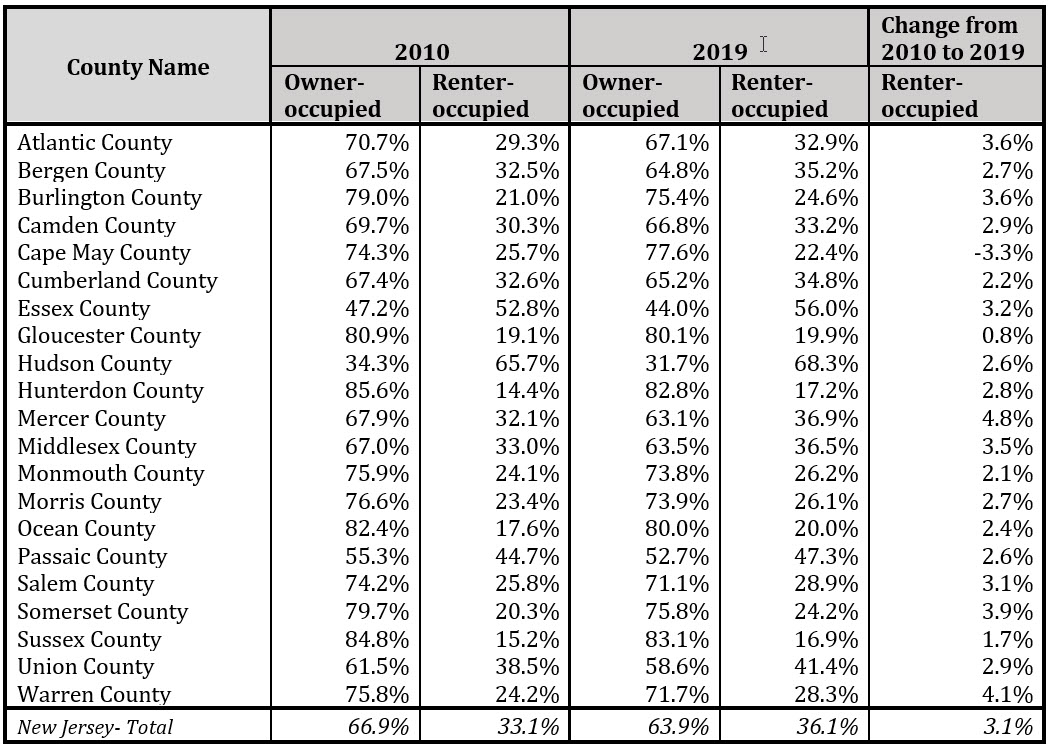
Source: U.S. Census Bureau, 2010, 2019. [4] Prepared by R/ECON™.
Data pertaining to housing costs (Table 1.2) indicate that in 2010 and 2019 nearly half of renter households in New Jersey spent 35 percent or more of their incomes on housing expenses (42.4 percent of renter households). The reason for this phenomenon is twofold: It points to a lack of affordable housing supply, and it shows that incomes within New Jersey have not kept pace with housing prices. Note that counties with higher shares of low-income residents (e.g., Atlantic, Cumberland, and Passaic) have greater proportions of renters who are shelter poor (i.e., spend 35 percent or more of their income on housing expenses). In contrast to renter-occupied households, about a quarter of owner-occupied households (with a mortgage) were shelter poor in 2019 (26.8 percent of owner-occupied households); this 2019 figure marks an improvement from 2010, as 8.7 percentage points fewer owner-occupied households were shelter poor.
Table 1.2. Shelter Poverty (35% or more of Income Spent on Housing) by Tenure: NJ Counties, 2010 and 2019
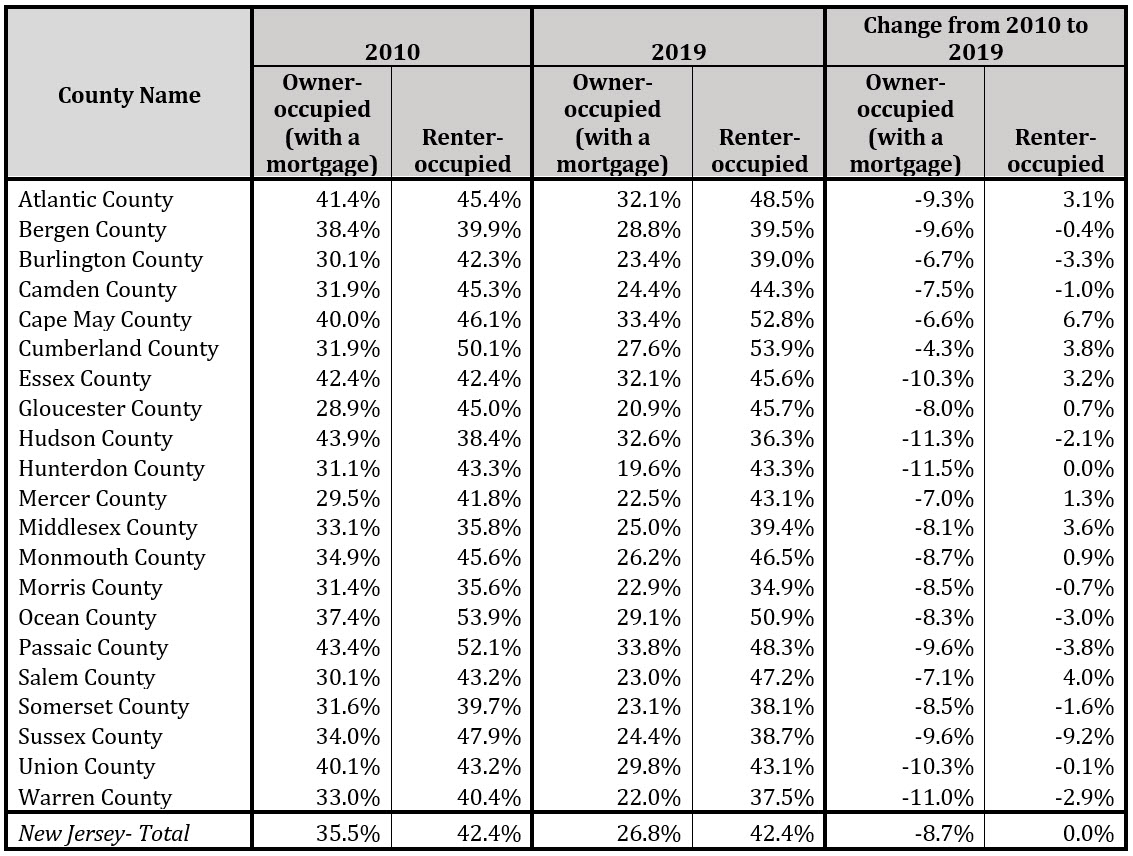
Source: U.S. Census Bureau, 2010, 2019. [5] Prepared by R/ECON™.
Another way to assess changes in affordability is to examine the extent to which housing is overcrowded. According to the U.S. Department of Housing and Urban Development, overcrowded housing is defined as a housing unit with more than one person-per-room (PPR).[6] Table 1.3 shows that the magnitude of overcrowding statewide stagnated from 2010 to 2019: 96.8 percent of households were not overcrowded. Meanwhile, extreme overcrowding (1.51 or more PPR) edged downwardly from 1.3 percent to 1.1 percent between 2010 to 2019.
Although the 2019 rate of overcrowding in New Jersey stood at 3.3 percent —0.1 percent below the national average— Table 1.3 displays notable variations across counties: Hudson County had the highest rate of overcrowding in 2019, at 7.7 percent, followed by Passaic (6.8 percent), Essex (4.6 percent), Union (4.5 percent), and Middlesex (4.2 percent).
Table 1.3. Persons Per Room (PPR) in Occupied Housing: NJ Counties: 2010, and 2019
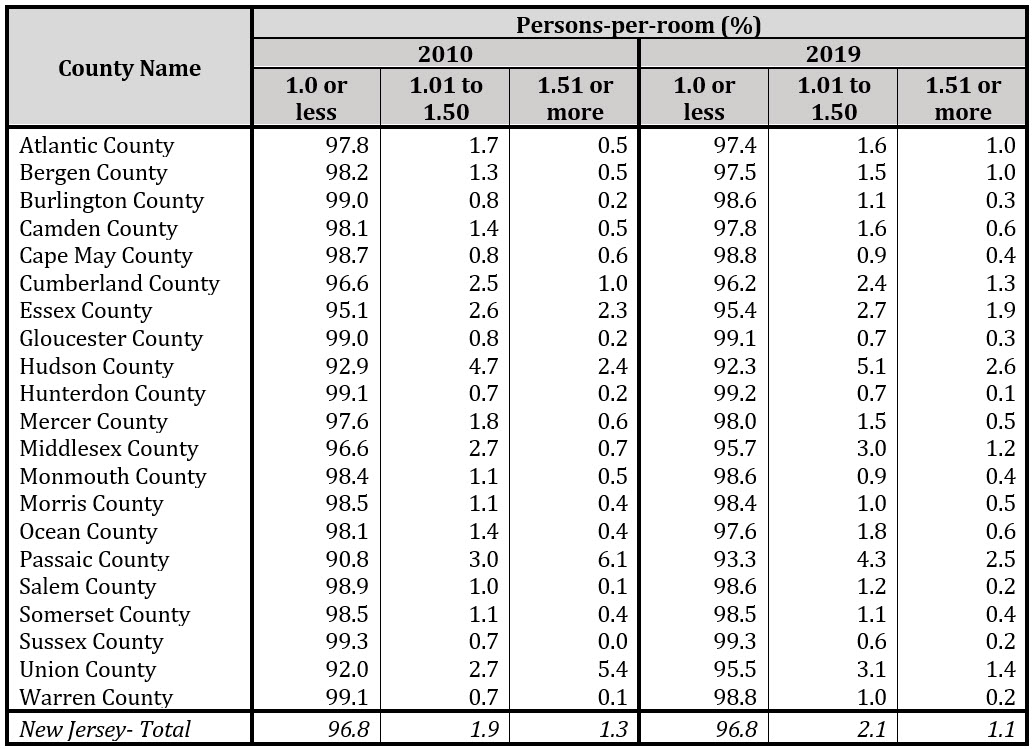
Source: U.S. Census Bureau, 2010;[7] 2019. [8] Prepared by R/ECON™.
In sum, our analysis on housing affordability and ownership accessibility reveals an increase in “rentership” from 2010 to 2019, coupled with a high and consistent share of renters who are shelter poor. Counties with higher shares of low-income residents had greater shares of renters who were shelter poor. Meanwhile, all New Jersey counties, with the exception of Cape May, experienced a rise in the share of renter households from 2010 to 2019. Overcrowding figures are more sanguine, showing no change in overcrowding rates from 2010 to 2019 and a slight decrease in extreme overcrowding (from 1.3 percent in 2010 to 1.1 percent in 2019).
References
[1] Poverty Research Institute. (2021). True poverty: What it takes to avoid poverty and deprivation in the Garden State. Legal Services of New Jersey. Retrieved from: https://proxy.lsnj.org/rcenter/GetPublicDocument/00b5ccde-9b51-48de-abe3-55dd767a685a
[2] Ibid.
[3] U.S. Census Bureau (2010-2019). DP04 Selected Housing Characteristics. American Community Survey 5-Year Estimates.
[4] Ibid.
[5] Ibid
[6] Blake, K. S., Kellerson, R. L., & Simic, A. (2007). Measuring overcrowding in housing. U.S. Department of Housing and Urban Development. Retrieved from: https://www.census.gov/content/dam/Census/programs-surveys/ahs/publications/Measuring_Overcrowding_in_Hsg.pdf
[7] U.S. Census Bureau (2010-2019). DP04 Selected Housing Characteristics. American Community Survey 5-Year Estimates.
[8] Ibid.