
by Gavin Rozzi
Efforts to collect statewide data on the opiate crisis in New Jersey have been underway since 2014 when former Attorney General John J. Hoffman issued a directive requiring local law enforcement to report all deployments of Narcan™ (Naloxone), the lifesaving overdose reversal drug.1
Since then, officials at the New Jersey State Police, Office of Drug Monitoring & Analysis have amassed thousands of geotagged records documenting state and local law enforcement’s response to the opiate crisis in New Jersey, an important resource for analyzing precisely which regions of the state have been affected by the opiate crisis.
Mapping out the opiate crisis in New Jersey using Uber’s H3 technology
We implemented Uber’s Hexagonal Hierarchical spatial indexing system, also known as H3 to analyze the data in a way that both facilitates the use of machine learning algorithms and preserves privacy2. This was achieved by dividing New Jersey into a series of 627 hexagons and counting the total number of opiate overdose incidents that fell within each hexagon’s geographic boundaries during 2019 – 2021 with these cells used to further analyze the data.
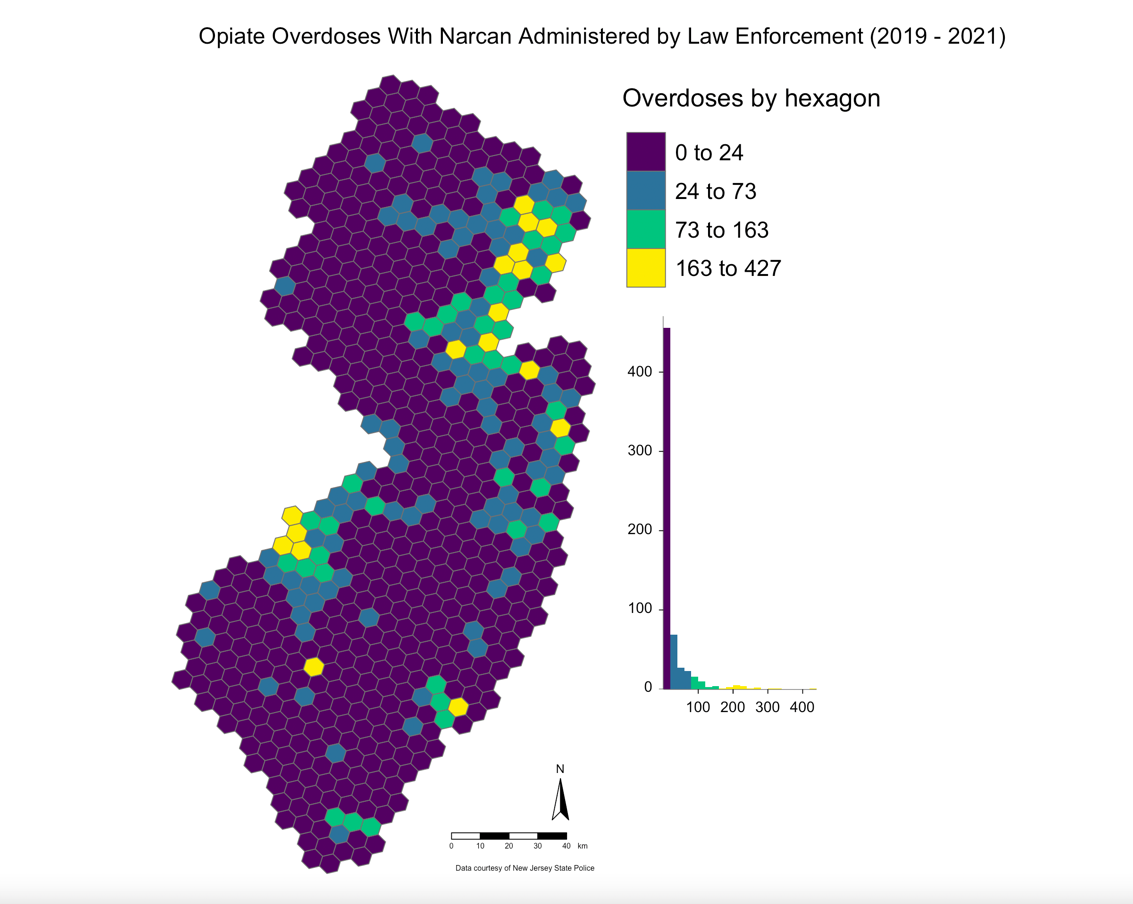
Figure 1 – A map of the total count of opiate overdoses where law enforcement deployed Narcan by hexagon cell since 2019.
Identifying hotspots for opiate overdoses in New Jersey
We identified clusters of Narcan incidents using the Local Indicators of Spatial Association statistics (LISA)3 This process used the count of law enforcement Narcan deployments in each hexagon from 2019-2021 to identify both “hot spots” and “cold spots” of overdose activity throughout New Jersey during the last three years and classified by their statistical significance using the GeoDa software package4.
Based on this analysis, each cell was classified based on the count of overdose incidents that occurred within its boundaries and that of its neighbors. Darker red cells (High-High) had high counts of overdose incidents recorded and also had neighboring cells with a high count. Conversely, darker blue cells (Low-Low) had a low count of incidents and also had neighbors with a low count.
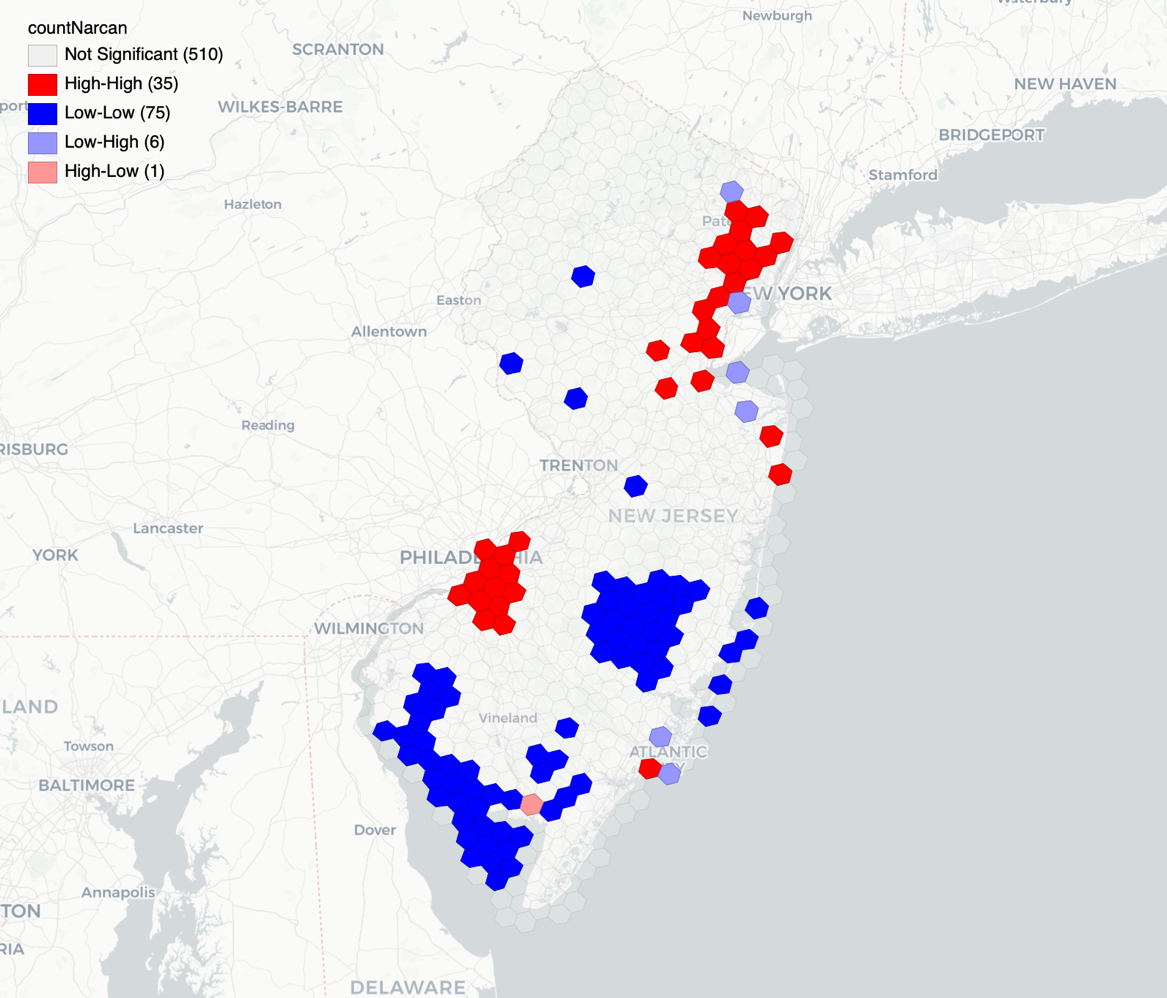
Figure 2- Hexagons that were identified as being the centers of “hot spots” or “cold spots” after spatial audio correlation analysis based on that total count of Narcan deployments in each cell.
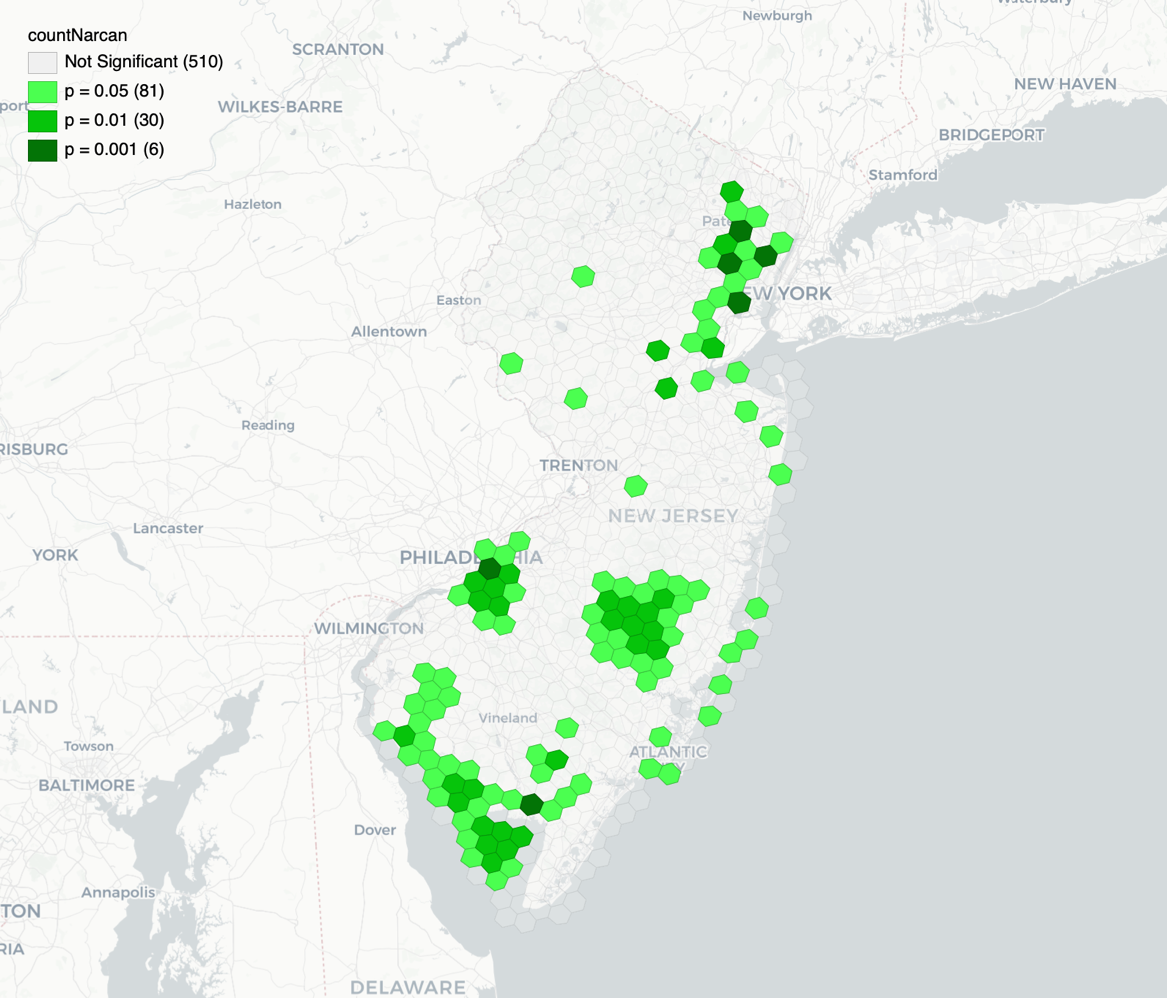
Figure 3 – Statistically significant hexagon cells that were identified as belonging to a cluster
Conclusion, limitations, and future directions
These preliminary results suggest that certain regions of the state have been more directly impacted by the opiate crisis than others, particularly urban areas of the state such as the City of Camden and its surrounding suburbs, as well as the northeastern, more urbanized regions of the state. A few smaller clusters were identified near Atlantic and Monmouth counties respectively. Our future work will entail fusing additional data sources with each grid cell to model how the built environment and other risk factors have driven the opiate crisis.
It is important to note that the conclusions of this analysis are based solely on data covering Narcan administrations that were performed by law enforcement officers in New Jersey since 2019. A more complete analysis would be possible by integrating additional data sources.
Acknowledgements
We would like to acknowledge Lt. Jason Piotrowski and Lt. Adam Polhemus of the New Jersey State Police, Office of Drug Monitoring & Analysis for their cooperation and assistance in obtaining the data used in this report.
References
[1] J.J. Hoffman, Attorney General Law Enforcement Directive 2014-2, New Jersey Office of the Attorney General, 2014. https://www.nj.gov/oag/dcj/agguide/directives/ag-directive-2014-2.pdf (accessed June 3, 2022)
[2] I. Brodsky, H3: Uber’s Hexagonal Hierarchical Spatial Index, (2018). https://eng.uber.com/h3/ (accessed May 27, 2022).
[3] L. Anselin, Local Indicators of Spatial Association—LISA, Geogr. Anal. 27 (1995) 93–115. https://doi.org/10.1111/J.1538-4632.1995.TB00338.X.
[4] L. Anselin, I. Syabri, Y. Kho, GeoDa: An introduction to spatial data analysis, Geogr. Anal. 38 (2006) 5–22. https://doi.org/10.1111/j.0016-7363.2005.00671.x.