
By Angie Nga Le
Between October 7 and November 14, 2024, the New Jersey State Policy Lab conducted a brief survey to gain insights into emerging issues and policy priorities in New Jersey. The survey aimed to inform the Policy Lab’s strategic research planning, ensuring the organization continues to deliver rigorous, evidence-based policy research that addresses the evolving needs of New Jersey communities.
The survey was administered online through email invitations sent to key stakeholders of the Policy Lab. It was also publicly accessible via the Policy Lab’s official website and social media channels. The survey questionnaire included a multiple-choice section in which the participants were asked to select the top priorities from a list of policy issues in New Jersey. An open-ended question was also provided to allow respondents to share additional thoughts on key policy issues they believe should be prioritized for New Jersey. Respondents then answered background information questions at the conclusion of the survey. Participation in the survey was completely anonymous.
What are Top Policy Issues?
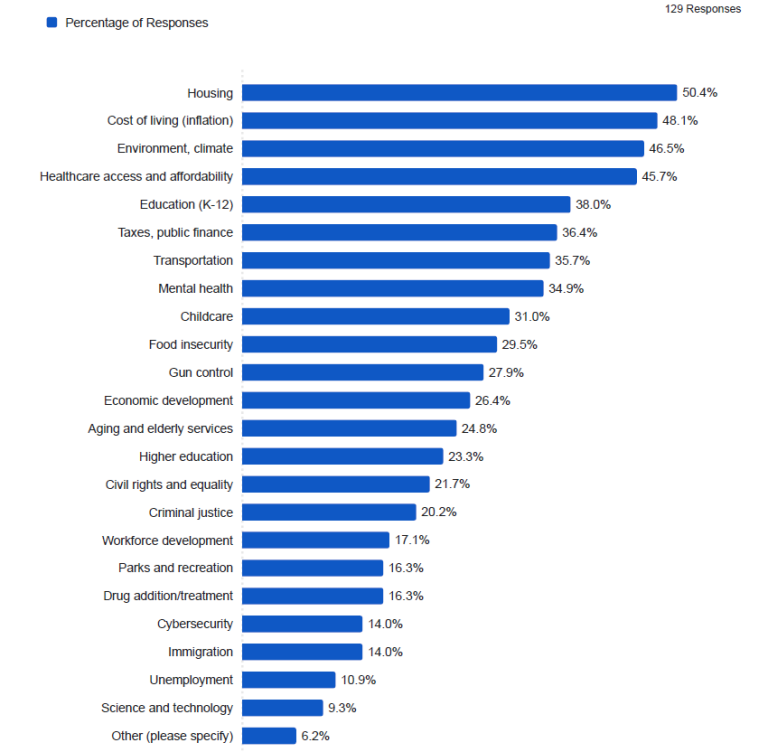
The survey presented 23 policy issues for participants to consider. Housing emerged as the top concern, with more than half of respondents identifying it as the highest priority for New Jersey (Figure 1). Other key issues, selected by over 40% of respondents, included the cost of living/inflation, environment and climate, and healthcare access and affordability. In contrast, issues such as workforce development, parks and recreation, drug addiction and treatment, cybersecurity, immigration, and unemployment received less attention, with fewer than 20% of respondents choosing them as top priorities. The issue of science and technology was the least prioritized, selected by about 9% of respondents.
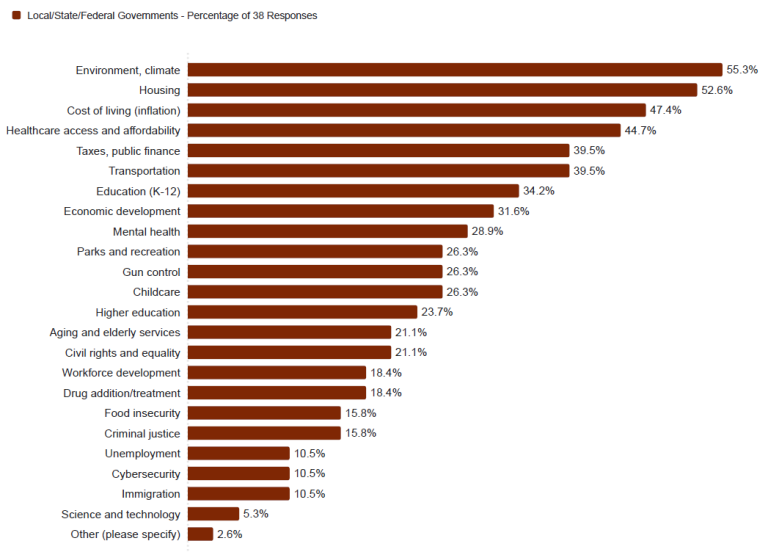
Over half of the 38 respondents employed by government agencies agreed that environment and climate, along with housing, were their top priorities (Figure 2). Among eight elected representatives, six selected taxes and public finance as their primary concern. Immigration, criminal justice, and K-12 education followed as secondary priorities, each chosen by four respondents.
In addition to the pre-identified policy topics from the survey, respondents also highlighted several other important priorities for New Jersey. Many expressed concerns related to land use planning, infrastructure and utilities, and transportation. Others emphasized specific challenges in healthcare, economics, and environmental and climate issues. A few respondents elaborated on housing concerns, while some mentioned other topics, such as declining fertility rate, diversity in law enforcement, and LGBTQIA+ rights.
Who are the Survey Respondents?
A total of 129 individuals responded to the survey, with 124 answering the demographic questions. Of these, the majority were employed (90%), while 5% were unemployed, and approximately 5% were self-employed or business owners. Among those employed, 48% worked at colleges or universities, and 33% were employed by government agencies. Smaller percentages worked for non-profit organizations (10%) or for-profit companies (4.3%). Additionally, eight respondents reported serving as elected representatives or officials. Some participants also identified as elected mayors, family business or farm owners, K-12 school staff, or freelancers. Over 94% of participants hold a bachelor’s degree or higher, with more than 68% having earned a graduate or professional degree.
The largest proportion of survey respondents were middle-aged, with 41% in the 45-64 age range. Additionally, over a third of participants were between 25 and 44 years old. Females comprised 64% of the participants, while 32% were male and 4% identified as other gender groups. In terms of racial and ethnic minorities, the largest group was Black or African American, representing 7% of participants, followed by Asian (6%), Hispanic or Latino (5%), Native Hawaiian or other Pacific Islander (2%), and Middle Eastern or North African (2%).